Operational Excellence
Evaluating Turnaround Time for Medical Imaging Studies: Why Defining Key Performance Indicators Matters
July 09, 2025 - AHRA Best Practices and Benchmarking Task Force
The AHRA Best Practices and Benchmarking Task Force is pleased to share this high-level overview of how results turnaround times are currently defined and measured across the medical imaging field. This summary will also serve as a foundation for an upcoming member survey — launching later this summer — that will gather more detailed information on best practices, as reported directly by AHRA members.
Your participation in the upcoming survey will be essential to helping us create a robust and meaningful dataset that supports benchmarking and continuous improvement in medical imaging services. We sincerely value your insights and look forward to your participation and valuable input.
In modern medical imaging, turnaround time (TAT) is a critical performance metric that impacts patient care, operational efficiency, and financial outcomes. Evaluating TAT allows medical imaging departments to evaluate their performance against industry standards, identify inefficiencies, and implement improvements. However, how TAT is defined and measured is crucial to ensuring that key metrics provide meaningful and actionable insights.
Understanding Turnaround Time in Medical Imaging
TAT in medical imaging generally refers to the time from when a study is ordered or performed to when the final report is available. However, different stakeholders — radiologists, technologists, referring providers, and administrators — may have varying definitions of when the clock starts and stops. Common TAT definitions include:
- Order-to-Final Report: The time from when a study is ordered to when the final medical imaging report is available.
- Order–to-Exam Start: The time from when a study is ordered to when the medical imaging exam is started.
- Exam Completion-to-Final Report: The time from when the imaging study has ended to when the final report is issued.
- Exam Completion-to-Preliminary Report: The time from when the imaging study has ended to when the preliminary report is issued.
- Critical Finding Found by Radiologist-to-Clinician Notification: The time from radiologist interpretation until the time the finding is communicated to the ordering/attending provider (critical results).
- Time Exam Ended by Tech to Time Images are Available for Radiologist Interpretation: This can be a key area to review for potential delays and streamlining where things such as batching exams, delays with paperwork, or transmission issues can occur.
Each of these definitions can break down the overall process of report TAT into incremental steps to help administrators understand where to dive deeper into the process. Often when a concern is raised, it comes in the form of a general concern about report TAT. It’s important to inquire deeper on how the person raising the concern perceives TAT, and having these metrics broken down into these steps can help identify where the bottlenecks and opportunities for improvement may exist. This understanding can then allow administrators to more effectively work with their teams to address the concern being raised.
In addition to just measuring times, many organizations may also be setting goals based on a percentage of time that they are meeting their TAT goals.
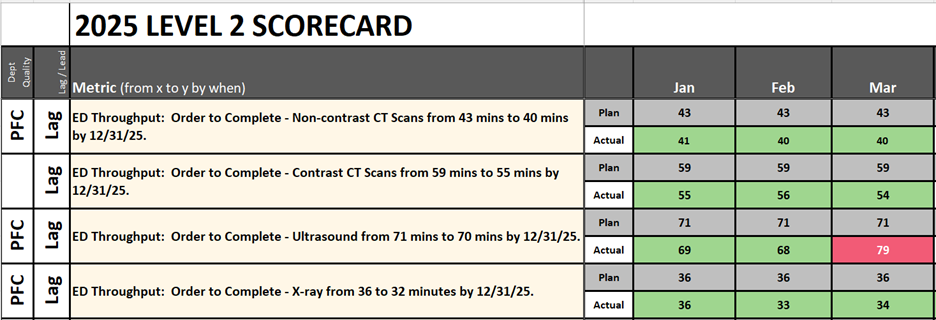
Once an organization or department determines its goals, they typically create dashboards or scorecards where their goals are tracked on a periodic basis. Often when goals are not met, it results in the need to create an action plan with tactics to steer back toward achieving your goals. Below is an example of one such scorecard.
Why Defining Metrics Matters
Ensuring Comparability Across Institutions
If different institutions define TAT differently, direct comparisons become misleading. For example, a hospital that measures from order entry may appear to have a longer TAT than one measuring from image acquisition, even if both process studies efficiently. Standardizing definitions helps ensure meaningful comparisons amongst peer groups.
Aligning Metrics with Clinical Impact
TAT should reflect its impact on patient care. In emergency and inpatient settings, reducing the time from image acquisition to report completion can expedite diagnosis and treatment. For outpatient imaging, ensuring timely reporting of non-urgent studies may have different priorities. Choosing the right TAT metric ensures the focus remains on clinically relevant improvements.
Accounting for Variability by Modality and Priority Level
TAT expectations vary significantly between imaging modalities (e.g., x-ray vs. MRI), facility type, location, and priority levels (e.g., STAT vs. routine studies) and equipment capabilities. For example, there can be variability within a modality if some of the machines possess capabilities that make them faster than some of the others (MRI unit with AI capability). To create effective data comparisons, it is important to include these various parameters in your data analysis.
Identifying Bottlenecks More Effectively
A poorly defined metric may obscure the root cause of delays. For example, a slow TAT from order to final report could result from delays in scheduling, patient transport or preparation, image acquisition, or radiologist interpretation. By segmenting the TAT into meaningful intervals, medical imaging departments can pinpoint where they are performing consistently well and where improvements are needed.
Supporting Performance-Based Incentives
Many institutions link medical imaging TAT metrics to performance incentives. Clearly defining TAT metrics ensures that radiologists and technologists are measured fairly and that incentives drive the desired improvements — rather than encouraging rushed or low-quality interpretations to achieve the goal.
In addition to TAT, ideally incentives use a balanced scorecard approach and include other key metrics such as mammography call back rates, peer review compliance, reporting error rates, etc.
Best Practices for Key Performance Indicators (KPI’s) Around Medical Imaging TAT
- Adopt Standardized Definitions: Use industry-accepted definitions such as those from the American College of Radiology (ACR) or Radiological Society of North America (RSNA).
- Segment Data Appropriately: Compare TAT for different modalities, priority levels, and clinical settings separately.
- Leverage Automated Tracking: Use radiology information systems (RIS) and picture archiving and communication systems (PACS) to automatically track timestamps and reduce manual entry errors.
- Consider Mean TAT, Median TAT, and Percent of Time Goals Achieved: While mean TAT provides an overall picture, median TAT helps account for outliers that could distort the results. It might also be beneficial to consider the percentage of time you are achieving your goals to understand how many patients are impacted by not meeting goals.
- Set Realistic and Evidence-Based Goals: Avoid arbitrary targets, and instead set KPIs based on peer institutions and internal trends. Setting KPIs in today’s environment can been difficult. The goal of AHRA is to begin to collate and share these KPIs to help our members who lead imaging departments across the country every day.
- Consider Hour of Day, Remote Reading vs. Onsite Reading, and Sub-Specialty Interpretation Requirements and Preferences: Typically staffing levels decrease as the day wears on for technical staff, support staff, and sometimes radiologist staffing as well.
Moving Evaluation Into Action
Evaluating TAT data for medical imaging studies is essential for improving efficiency and patient care, but its effectiveness depends on how the metrics are defined. A well-structured approach ensures that comparisons are meaningful, performance issues are accurately identified, and improvements lead to real clinical and operational benefits.
By thoughtfully selecting and segmenting turnaround time (TAT) metrics, medical imaging departments can make informed, data-driven decisions that streamline workflows and elevate the quality of patient care. Through the collective expertise and collaboration of our AHRA members — and in partnership with key industry stakeholders — we aim to forge a path where imaging leaders can rely on peer-driven KPI data as a trusted resource for continuous learning, innovation, and improvement.